基于MAX5891 的差分輸出的測量方法簡介

本文引用地址:http://www.104case.com/article/193020.htm
VCODE是計算的DAC輸出電壓值。
下面的等式用于計算任意給定編碼的DNL:
DNLCODE(LSBs) = [VCODE - VCode-1 - VLSB]/VLSB(公式4)
其中
CODE是要計算的數字編碼。
VCODE是針對CODE計算的DAC輸出電壓值。
VCODE-1是針對CODE - 1計算的DAC輸出電壓值。
VLSB是公式2中計算的電壓值。
以下舉例說明利用MATLAB腳本計算MAX5889、MAX5890和MAX5891的線性度。每次計算都得到最小和最大DNL和INL誤差編碼和誤差值。實例還為所有編碼畫出了傳輸函數,得到INL和DNL。要求用戶輸入前面表格中所列出編碼的電壓測量值。必須按照所列順序輸入數值。
計算16位線性度的MATLAB腳本
function Lin16(Measurements)
%Calculate INL and DNL of a 16-bit device with a 5-4-3-4 segmentation architecture
% DacCodes is the range of possible input data to the 16-bit DAC
DacCodes=[0:65535]’;
%VOUT for each code is calculated from the measured points
%create a VOUT variable and fill it with zeros
VOUT=zeros(size(DacCodes));
%The first measurement is the zero-scale point, or code (0x0000)
ZS=Measurements(1);
VOUT(1)=ZS;
%The last measurement is the full-scale point, or code (0xFFFF)
FS=Measurements(length(Measurements));
VOUT(65536)=FS;
%Midscale is stored at position 43 of the input data array
MS=Measurements(43);
%The device has four segmentation levels
Segments=4;
%The decimal values for the LSB codes are 1, 2, 4 and 8
Seg1Codes=[1;2;4;8];
%The voltages for the LSBs are in positions 2-5 of the input array
for i=1:4
Seg1V(i)=Measurements(i+1)-MS;
end
%The second level of segmentation is controlled with input codes 16 through
%112 in steps of 16. Create the code array and fill the measurements for
%this segmentation level
Seg2Codes=[16:16:16*7]’;
for i=1:7
Seg2V(i)=Measurements(i+5)-MS;
end
%Segmentation level 3 uses input codes 128 through 1920 in steps of 128.
%Create the code array and fill the measurements array.
Seg3Codes=[128:128:128*(2^4-1)]’;
for i=1:15
Seg3V(i)=Measurements(i+12)-MS;
end
%Segmentation level 3 uses input codes 2048 through 63,488 in steps of 2048.
%Create the code array and fill the measurements array.
Seg4Codes=[2048:2048:2048*(2^5-1)]’;
for i=1:31
Seg4V(i)=Measurements(i+27)-ZS;
end
%The endpoints have been defined, now fill in the voltages for the
%remaining points of the DAC transfer function.
for i = 2:65535
targetcode=i-1;
VOUT(i)=ZS;
for s=31:-1:1
if Seg4Codes(s)=targetcode
targetcode=targetcode-Seg4Codes(s);
VOUT(i)=VOUT(i)+Seg4V(s);
s=0;
end
end
for s=15:-1:1
if Seg3Codes(s)=targetcode
targetcode=targetcode-Seg3Codes(s);
VOUT(i)=VOUT(i)+Seg3V(s);
s=0;
end
if targetcode==0
s=0;
end
end
for s=7:-1:1
if Seg2Codes(s)=targetcode
targetcode=targetcode-Seg2Codes(s);
VOUT(i)=VOUT(i)+Seg2V(s);
s=0;
end
if targetcode==0
s=0;
end
end
if targetcode==0
s=0;
end
for s=4:-1:1
if Seg1Codes(s)=targetcode
targetcode=targetcode-Seg1Codes(s);
VOUT(i)=VOUT(i)+Seg1V(s);
end
end
end
%Plot the transfer function
figure(1)
plot(DacCodes, VOUT);
xlabel(‘DAC Input Code’);
ylabel(‘Measured Voltage’);
axis([0 65536 -1.1 1.1]);
title(‘DAC Transfer Function’);
set(gca,’XTick’,0:16384:65536)
%Calculate the linearity
LSB=(max(VOUT)-min(VOUT))/65535;
INL(1)=0;
DNL(1)=0;
for i=2:65536
INL(i)=(VOUT(i)-(VOUT(1)+(i-1)*LSB))/LSB;
DNL(i)=(VOUT(i)-VOUT(i-1)-LSB)/LSB;
end
%Plot INL
figure(2)
plot(DacCodes, INL);
title(‘DAC Integral Linearity’);
xlabel(‘DAC Input Code’);
ylabel(‘INL (LSBs)’);
axis([0 65536 min(INL)*1.1 max(INL)*1.1]);
set(gca,’XTick’,0:16384:65536)
%Plot DNL
figure(3)
plot(DacCodes, DNL);
title(‘DAC Differential Linearity’);
xlabel(‘DAC Input Code’);
ylabel(‘DNL (LSBs)’);
axis([0 65536 min(DNL)*1.1 max(DNL)*1.1]);
set(gca,’XTick’,0:16384:65536)
txtstr=sprintf(‘INL MAX = %f’, max(INL));
disp (txtstr);
txtstr=sprintf(‘INL MIN = %f’, min(INL));
disp (txtstr);
txtstr=sprintf(‘DNL MAX = %f’, max(DNL));
disp (txtstr);
txtstr=sprintf(‘DNL MIN = %f’, min(DNL));
disp (txtstr);
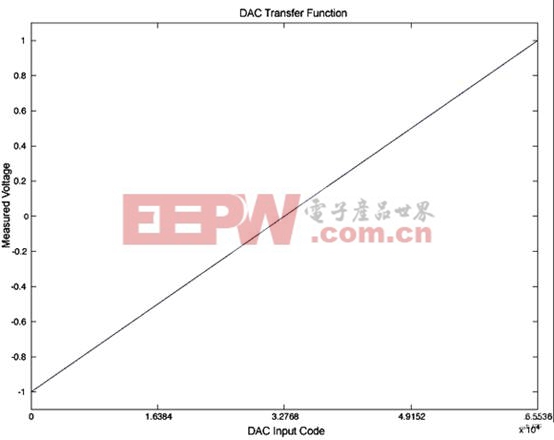
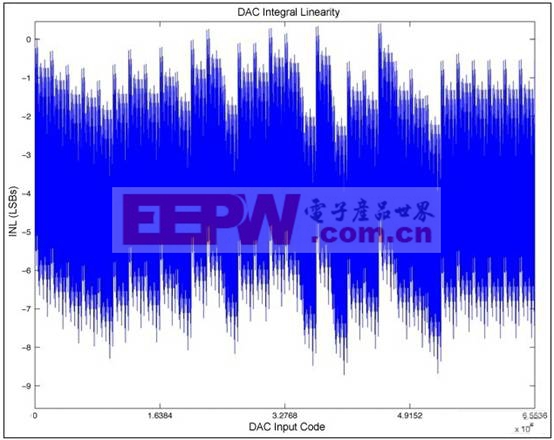
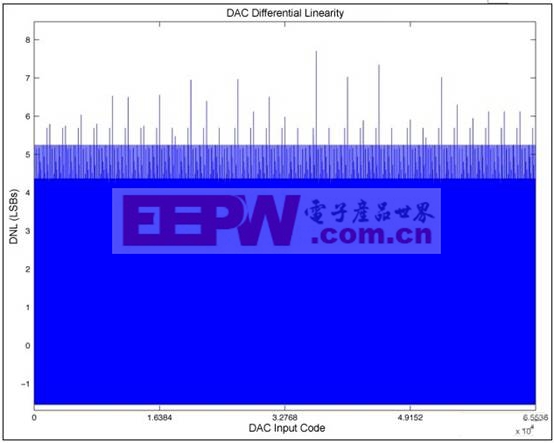
16位腳本產生的曲線

評論